
Octopoda Biodiversity Analysis
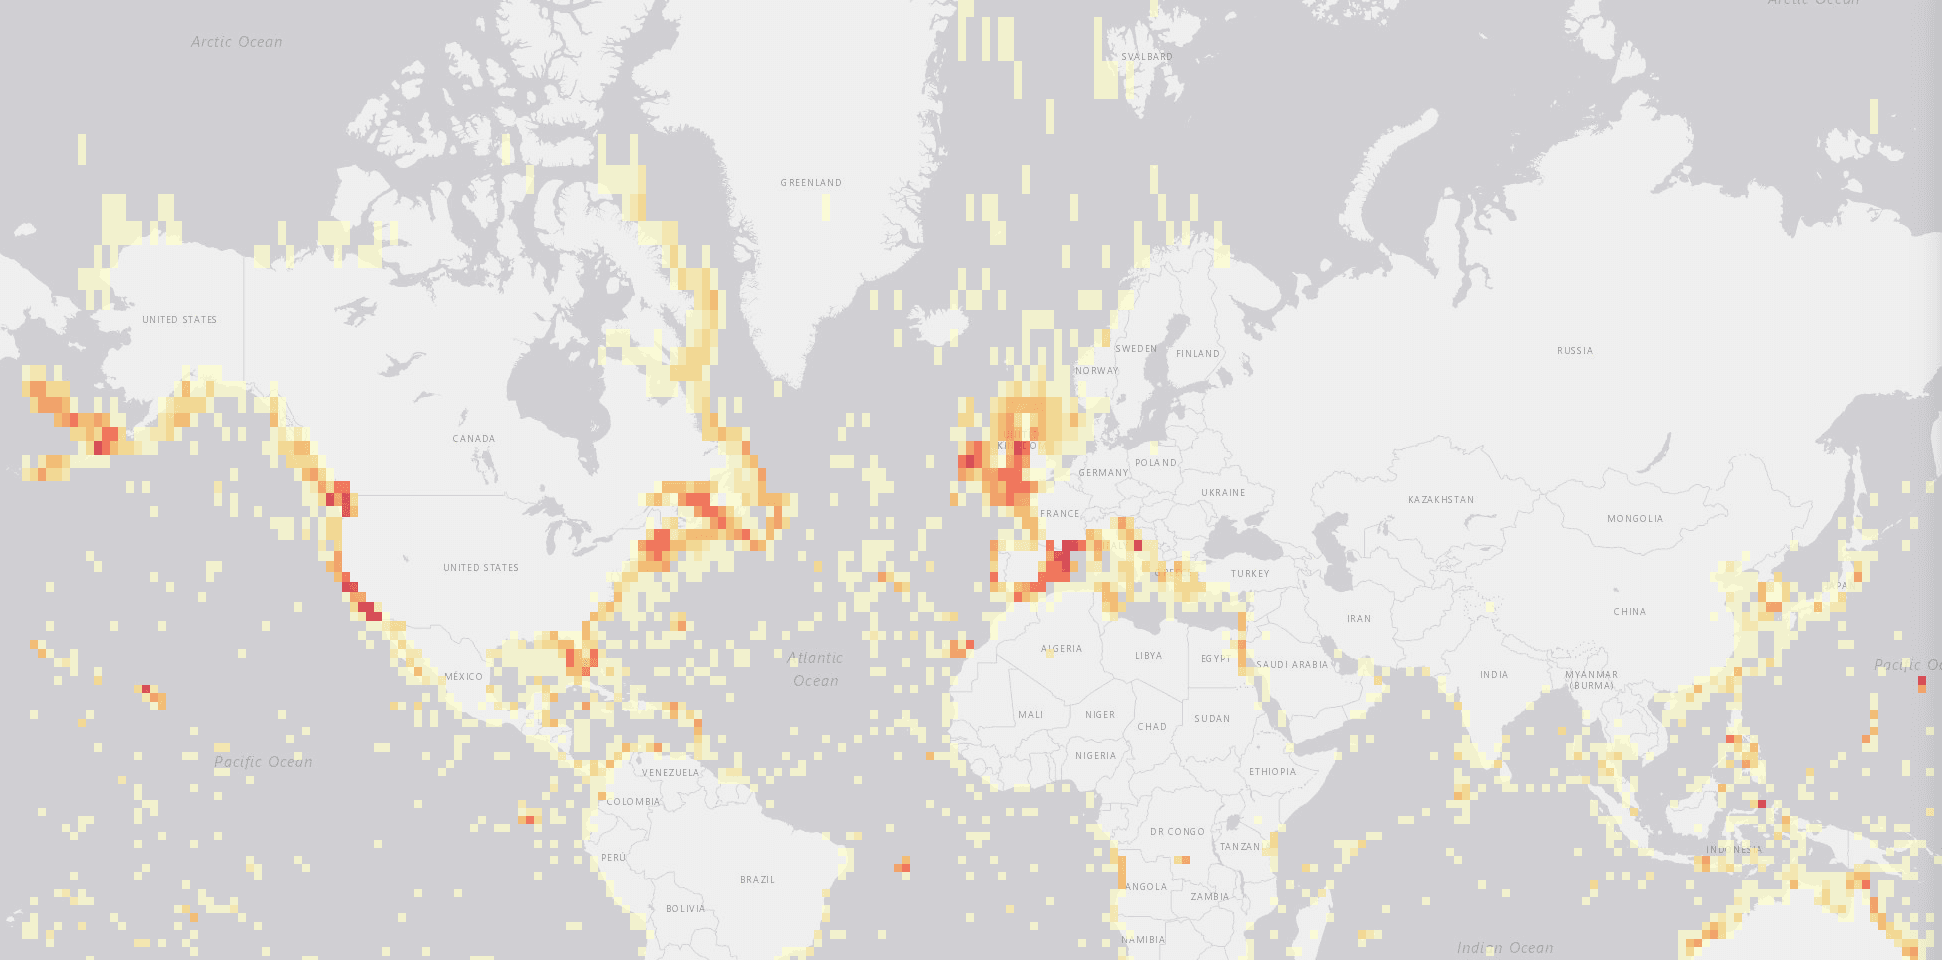
Exploring octopus records through data analysis and visualisation.
Where have octopuses been recorded around the world, and what can those records tell us about their environment? This project explores those questions using public data from the Ocean Biodiversity Information System (OBIS), combining Python analysis with an interactive Power BI dashboard. I worked through the full process, from preparing the raw data to building models and presenting the results. Using pandas and NumPy, I checked geographical coordinates, reviewed missing information, investigated repeated observations, and removed records flagged as being on land. Data quality became an important part of the project: almost half of the records lacked species-level identification, so those gaps needed to remain visible throughout the analysis.
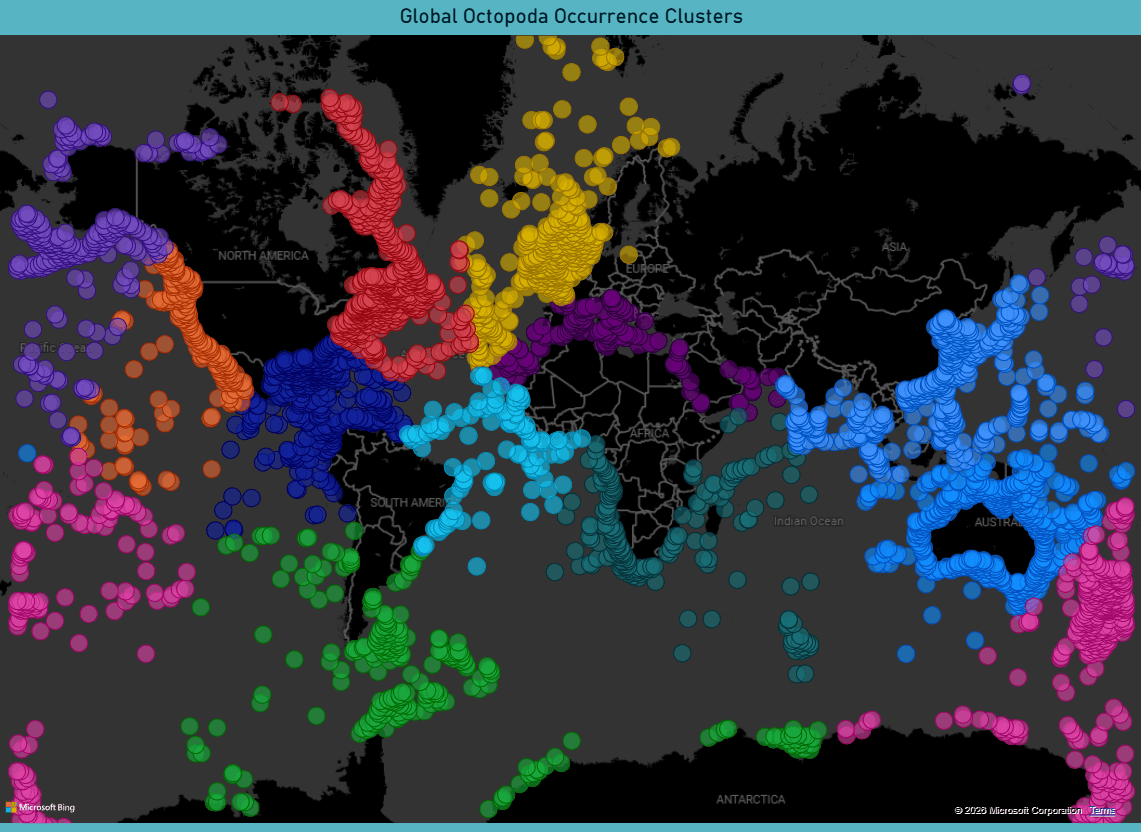
To explore geographical patterns, I used K-Means clustering to organise the records into twelve regional groups. Before clustering, I converted latitude and longitude into three-dimensional coordinates to better represent locations on a globe. I then compared different cluster counts to assess how clearly the groups were separated. The next stage examined sea surface temperature patterns using weighted regression, drawing on more than 60,000 occurrence records across eleven regions with sufficient temporal data. I also explored relationships between temperature, depth, seabed depth, and distance from shore, considering how geographical location and year affected the results.
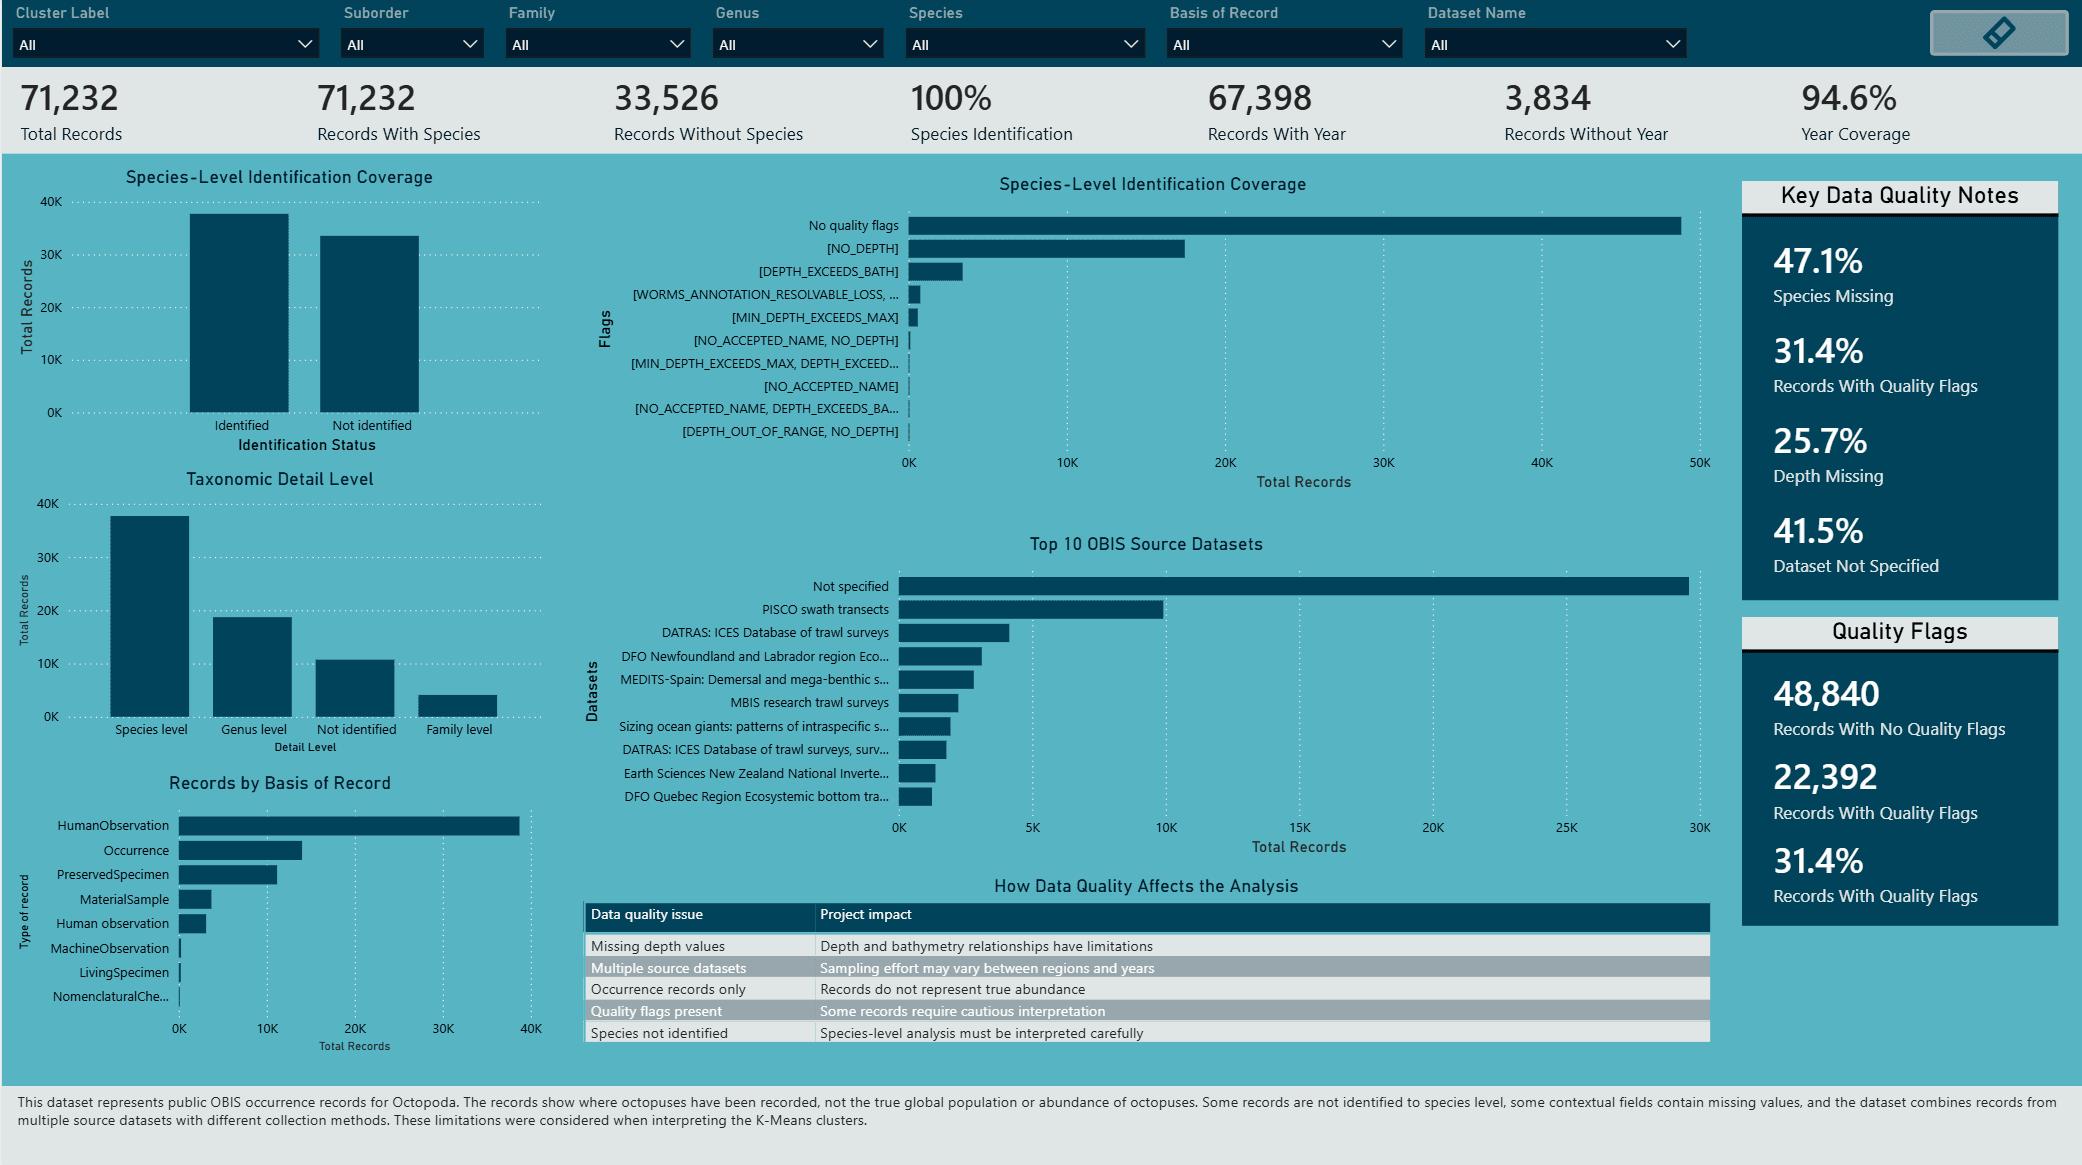
The Power BI dashboard brings these elements together through maps, charts, filters, and dedicated views for regional comparisons, taxonomy, and data quality. It lets users move from a global overview to individual regions and inspect the observations behind the analysis.
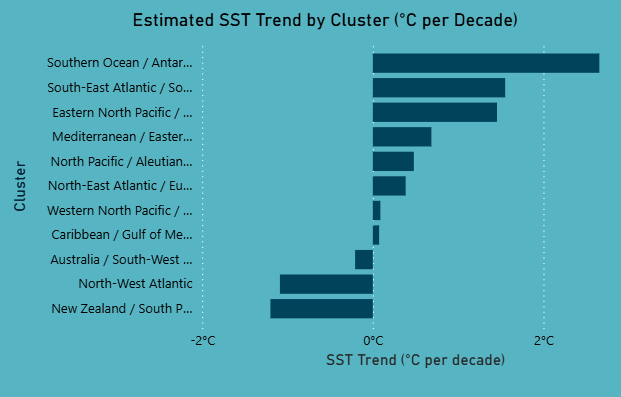
A central consideration was interpreting the findings carefully. More records in an area can reflect greater research activity rather than more octopuses. The project therefore presents exploratory patterns, with their limitations, rather than claims about population changes or migration. It gave me practical experience connecting data preparation, machine learning, statistical analysis, and visual communication within one workflow.
